We brought you top, htop, and now we are bringing you btop. A clickable interface with some fun styling options right out of the box. You get everything you get traditionally from a top implementation, with a unique and playful interface. The oldest commit to date, as per the time of writing this blog, btop seems to be just under a year old. Written in C++, an object-oriented subset of C, meaning you will be running this as native as operating system code gets. Maybe you like running highly customized window managers, or perhaps you just like to look at data with some flare. Btop can bring that home for you. Ported from a Python project called bpytop reducing the dependencies to gcc-libs, which many of us have already in our system. Making btop a great low resource application.
We will cover how to install btop in a few different ways. Then we will go over how to call it in terminal, as well as a few alternative ways of calling btop. We will then go over customizing your data interface, so your eyes can drink it all up. Finally, we will go through the available themes. You can customize many aspects of the interface. This includes, graphs, backgrounds and over all color themes. Bringing you a fancy interface, with very useful information for technically minded people. Once you set up your own Linux system, you can appreciate having eyes on normal behaviors. Giving you an edge on, let’s get right into it!
Installation
Arch
sudo pacman -S yay && yay -S btop
openSUSE
sudo zypper install btop
Source
It is possible to use source to install btop on many distributions, as that is the beauty of source. However, the packages needed to build from source are slightly different per distribution.
Debian
sudo apt install coreutils sed git build-essential gcc-11 g++-11 && git clone https://github.com/aristocratos/btop.git && cd btop && make && sudo make install
RHEL
sudo dnf install coreutils sed git build-essential gcc g++ && git clone https://github.com/aristocratos/btop.git && cd btop && make && sudo make install
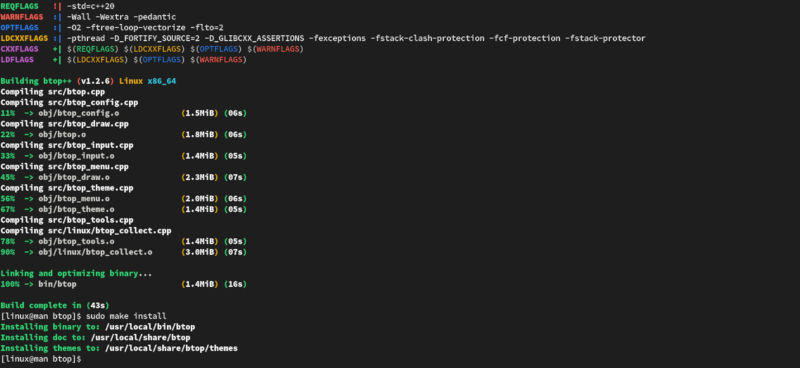
The needed packages are often part of systems like Arch and Gentoo since they are used to build the operating systems themselves. Here you can see the names for the gcc and g++ compilers are different between Debian and RHEL. So with a little research, you too can install from source as long as your distribution has the build tools.
Calling btop
Calling btop is just like any other top application. You can simply call it in terminal like so.
btop
This is cool if you just want to spot check. In a window manager environment you can call it to a particular desktop. For this, you will need to write a very short bash script that will both open the terminal and then call btop. This should look like this for a generic example.
					#!/bin/bash

terminal -- btop
You could also turn this script into a service on a regular desktop environment. With my i3WM setup, I use gnome-terminal for displaying all types of things. So, my bash script looks something like this.
					#!/bin/bash

gnome-terminal -- btop
You can then call this script in an alias in your bashrc or zshrc. You can also use the following configuration in i3WM.
					set $ws6 "📊"
bindsym $mod+6 workspace $ws6
bindsym $mod+Shift+6 move container to workspace $ws6

exec --no-startup-id i3-msg 'workspace 📊 exec ~/.bash/bin/btop.sh'
assign [class="BTOP"] → 📊
for_window [class="BTOP"] fullscreen
This will generate a btop on workspace 6 along with a key bind to the number 6 on the keyboard. You can choose any emoji you want for btop, as you can see, there are actually a few ways to call btop.
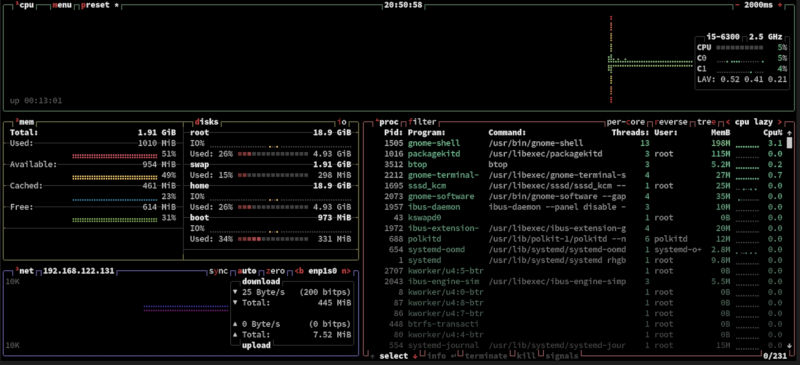
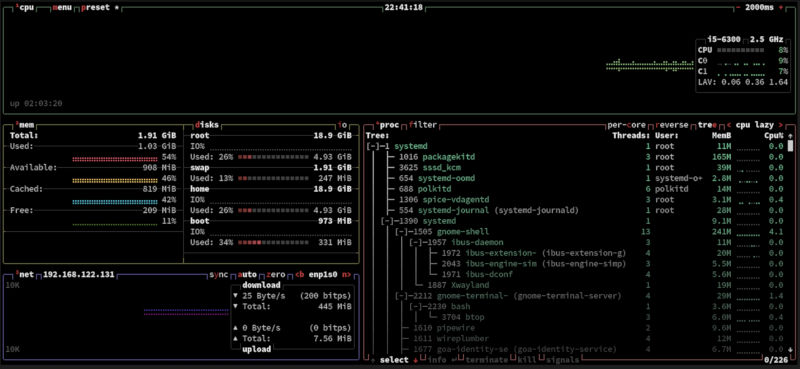
Data Output
The data output can be viewed in a few different ways. You can move the panels around. Change the statistics to monitor and so on. You can click on btop over section headers and settings within to produce different results. Making your data accessible, just how you would like it to look. Let’s click on the menu.
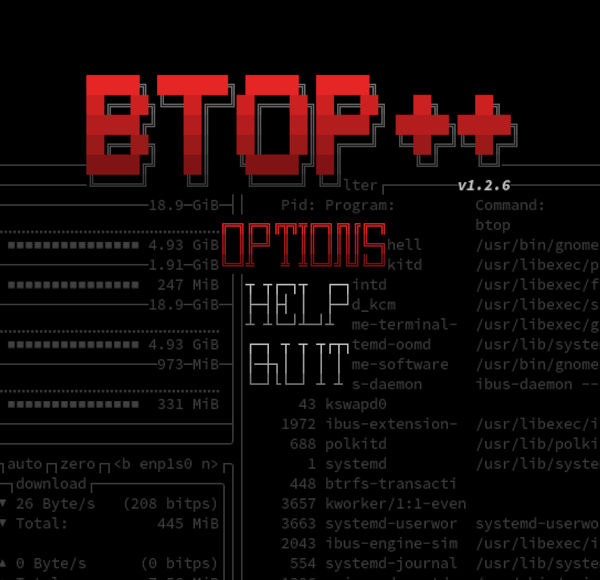
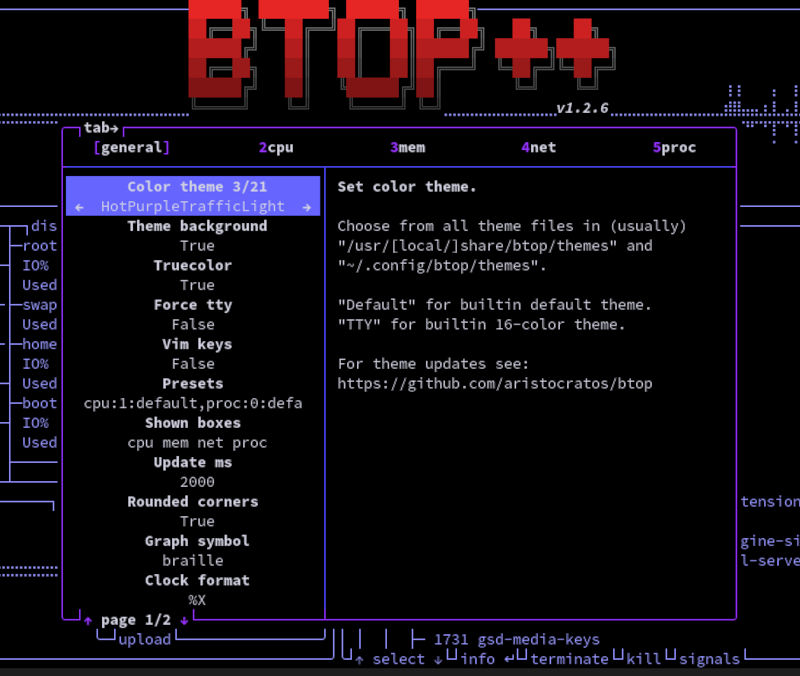
Now we can click on different options to see what you can change. Make sure to check out what you can click. You will be pleasantly surprised.
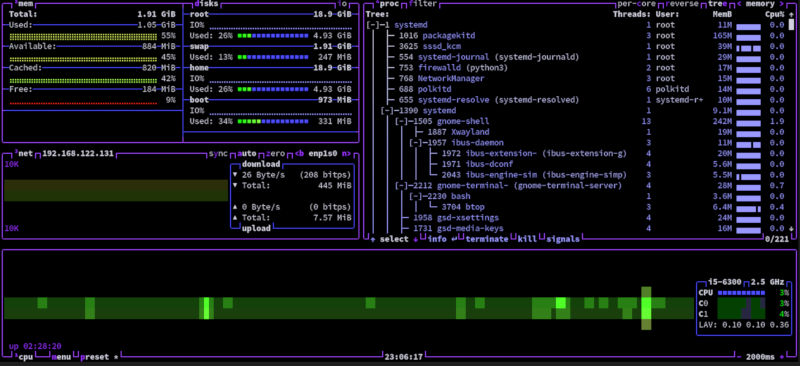
All it takes to get out of the menu is to type q to quit, similar to htop. Now you can see the different things you can adjust. Back in the main display we can tree the top processes, we can even set it to monitor by memory.
As you can see, the data experienced in the panel can be changed to how you see fit. Making a highly customized data feed. You may notice after a while that different application present different behavior. Browsers are often the gluttons of the user space world. Streaming and gaming are often heavy as well. It is also interesting to see network rates. You can compare networks and give yourself the best chance for the speed you want.
Themes
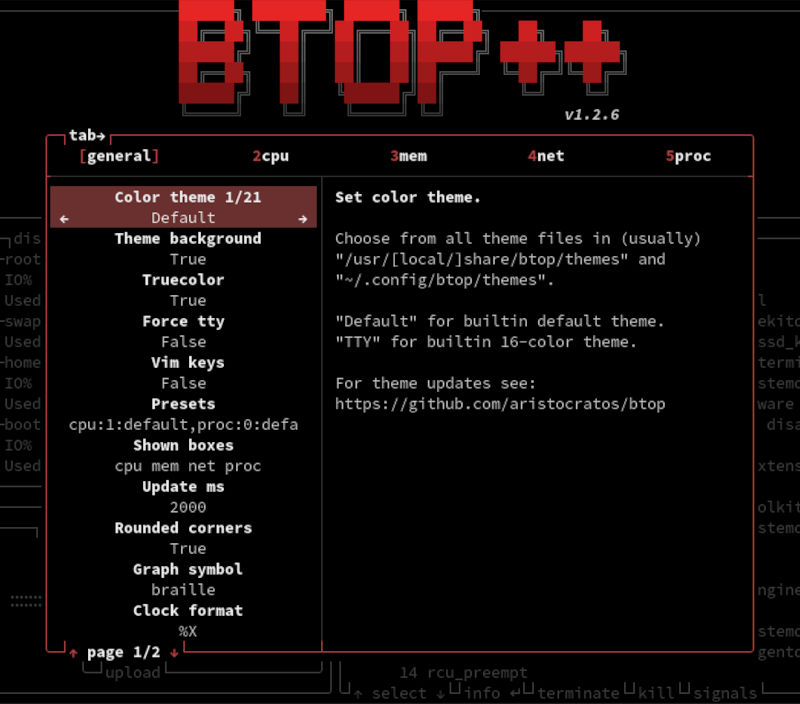
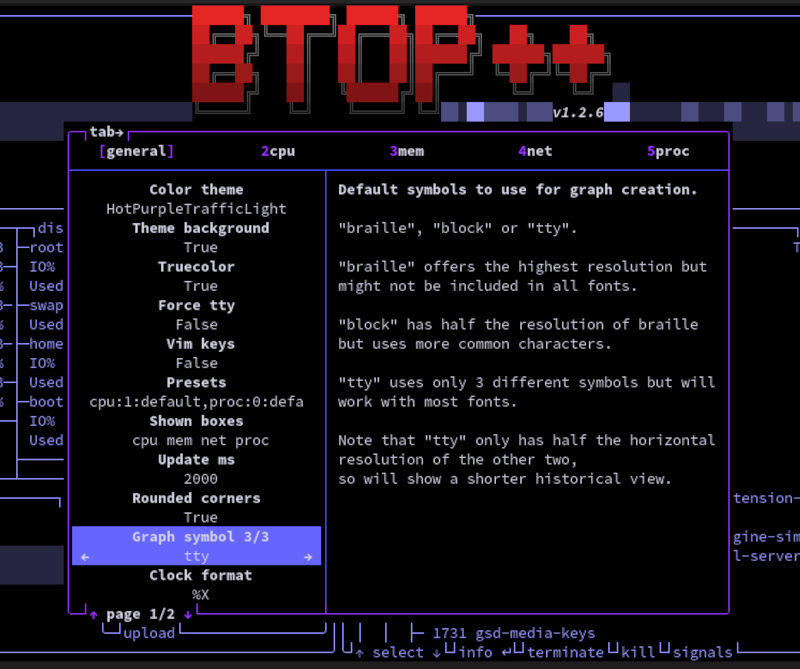
Inside the options you will also notice you can change the themes of the different gauges and graphs. All it takes is playing with the settings a little. You can select a section and a setting. Some of which you can type in a value and others are just toggled.
As you can see, we can change the entire theme, background and more.
Here you can see all the different sections with independent formatting along with the color schema. You can see all the sections have controls for all kinds of things. It is also effortless to move the panels around.
The way to change the configuration file and make these values more persistent is by editing ~/.config/btop/btop.conf.
vim ~/.config/btop/btop.conf
Type a to edit this file.

You can go ahead and hit Esc to stop editing. Then you can type :wq to write and quit the file. You may recognize the values from the menu options. So, you can just choose as you see fit to change this file to reflect the data in which you would like to see. When it comes to top processes monitoring applications, btop has all the of the functionality of top or htop, with more control and a lot of built-in customization. Making sure you know what is going on when testing code for resource consumption. For checking on just about anything on your system. Btop has a clock and even a battery display for laptops. Perhaps you have an older computer, and you want to see how things run on your system. Btop can be the real-time data fetcher you need.