How do you monitor your server? Do you use something like top? We love top because it is on systems by default a lot of the time. Well, htop is a more modern, somewhat improved version of top. First built back in 2004, htop is meant to bring you the topology of a system. Bringing you everything that top brings, with a lite graphic interface. Written in C, htop is natively compatible with Unix like systems. Making Linux distributions, BSD (Berkeley Software Distribution), and macOS are all perfect to monitor with htop. In fact, you may have seen htop in comedy shows like Silicon Valley. One of the characters used htop to monitor their server from his desk set up. So htop has even found its way to pop culture.
You can expect all the readings you get from top, with color coding from the start. You can also expect to see some bar for the RAM and CPU usage. Furthermore, you will see your system’s load as well. Apart from the visual differences, you can customize your colors. Making it match even the most customized distributions. Today we are going to show you how to install it on a few systems. Next, we will show you how to customize it to your needs. Then we will show you some practical use cases for it. Now, we think that you will find this blast from the past incredibly useful. If you use a window manager, you can htop as many servers up as you require. Setting you up for success!
Installation
To install htop is pretty easy. From the experience of this writer, there has never been a need to add a repository or any special configurations to use htop. So, we will demonstrate how to install htop on Arch, Debian, and openSUSE distributions and all the distributions based on them.
Arch
sudo pacman -S htop
Debian
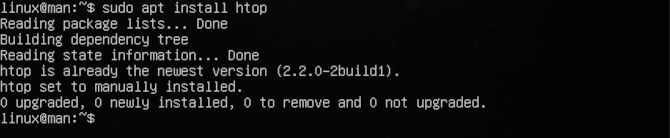
sudo apt install htop
openSUSE
sudo zypper install htop
Basics
Htop is simple to control with a minimal graphic interface. Using all the same commands as top and more. With a more robust customization schema. Let’s see what a tool like htop can be to have as an ace in the hole.
htop
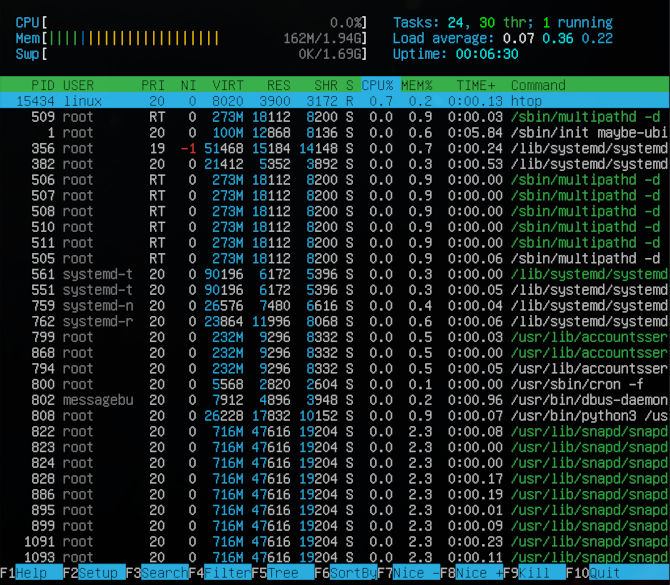
Looking over the above, you can see htop is called by its name in the command line to produce your systems’ topology. Furthermore, you will also notice that at the top you will see how many CPU cores you have and their level of usage. This is expressed in a left to right bar graph for each core. Below this is your RAM or memory, represented much the same way with a different label. Then below that will be a swap partition or file graph in similar fashion to the previously mentioned. To the right of RAM and swap is the load readings and task, along with up-time. Below these readings, you may notice that it looks very much the same as top. Beyond this, we would recommend you check out our blog on top. That way, you can learn how to change the way the data is seen in the feed. To exit htop, you only need to type q.
q
htop -h
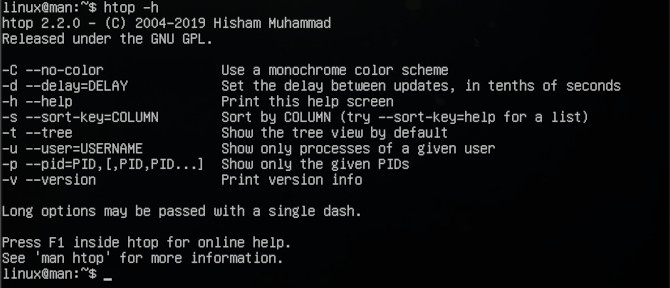
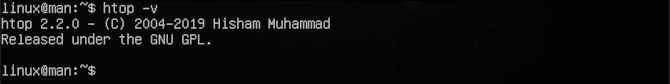
This will give you an overview of the commands available for htop. That way, you will never have to worry about getting lost in htop land. Next, you might want to know the version of htop that you are running.
htop -v
Let’s look at a way to look at the data differently.
htop tree
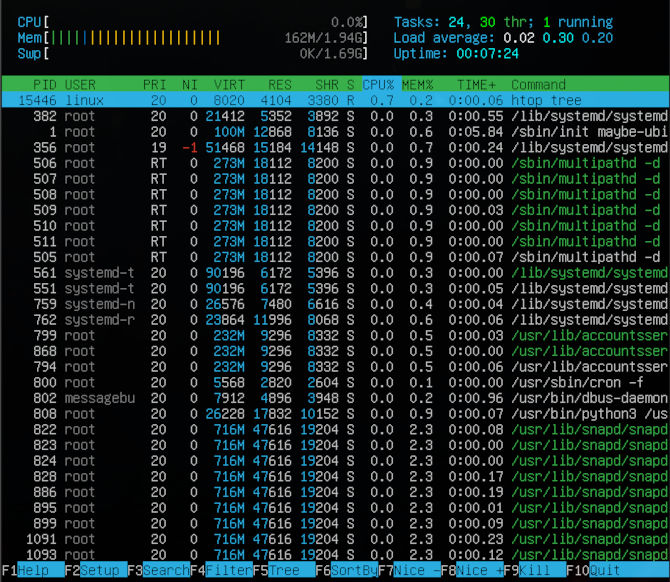
This will display the cascaded data in a correlating tree configuration. To exit htop, you only need to type q.
q
Now we will look at just one user’s data at a time. This is a bit of a recap from top.
htop -u linux
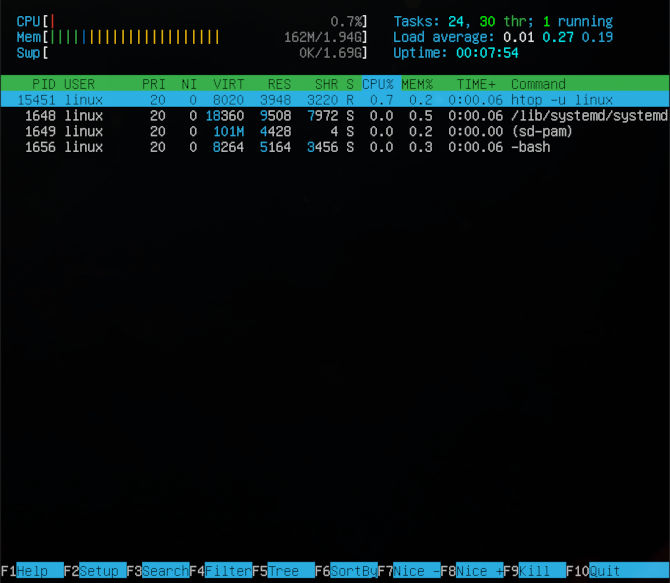
As you can see, the user linux is being displayed all by itself. This is useful when checking the productivity of an employee, or perhaps you want to isolate the usage on a server to find a system overage that cannot be explained.
Customization
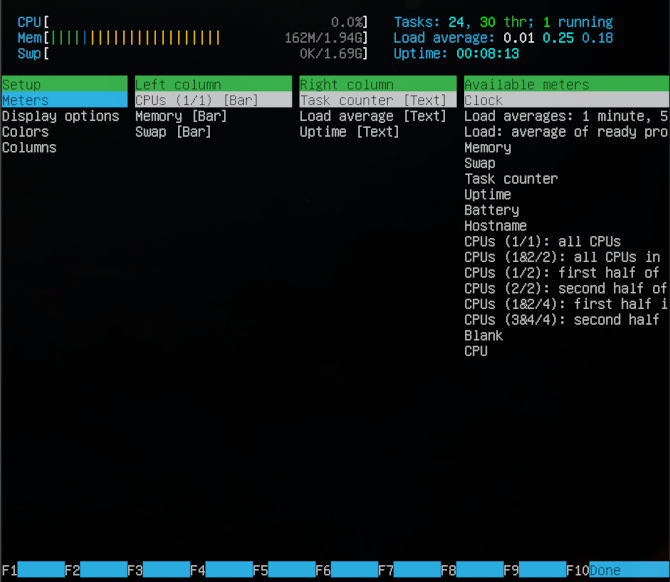
For anyone who likes to have some color in their terminal, or perhaps you need to differentiate servers that you are monitoring. We can customize htop in a few different ways. When using htop type C.
C
This will give a vast menu that you can access by using your arrow keys up and down. Furthermore, you can access each sub menu along with each displayed item. Allowing you to customize the way your data is displayed.
You can choose between some preloaded color choices.
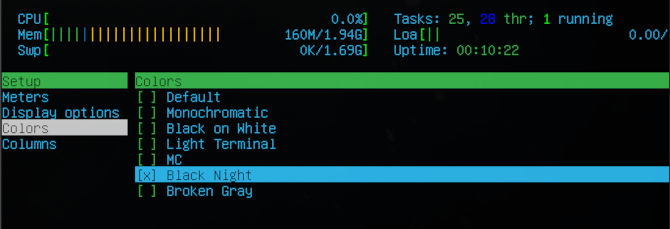
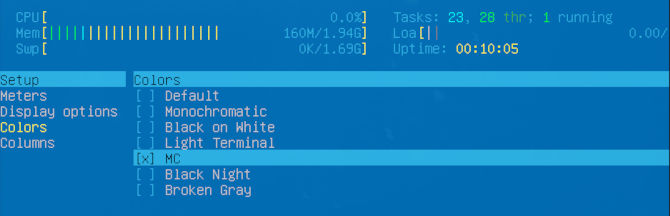
You can use a Midnight Commander type of look.
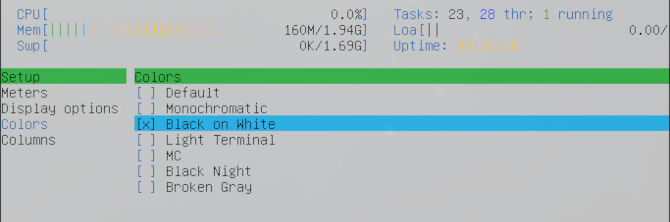
Whiteout blinding look or even darker schemas.
You can even display your data in a nice retro look with some wire framed green. These configurations are per user and loaded as such. You can go Vim into the htop configuration like so.
sudo vim ~/.config/htop/htoprc
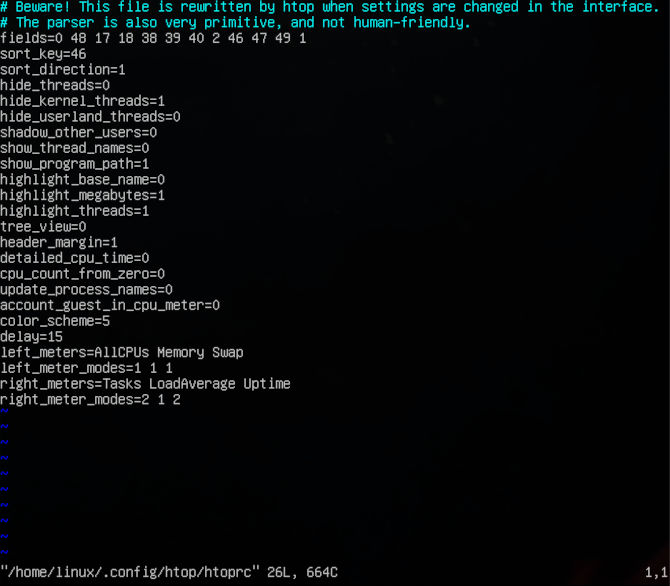
You may not want to edit anything in here, as you may not know what they do. But if you read through them. They are the same properties that can be found inside htop when you hit C. You can see that there are many True or 1 values as well as False or 0 values. These are boolean that turn a feature on or off, you may notice some other fields with number values that perhaps have to do with a color theme, for instance.
Htop has all the monitoring features you might need with a retro yet colorful interface. Besides neofetch, htop is one of the first things this author does after a fresh installation of any Linux distribution. Telling me how heavy a system is instantly. You can run htop on your Docker container, you will see very little. Only what you install in your container. If you run htop on a fresh installation of Arch, you will see less than 20 lines in your feed, boasting your minimal system needs. The most important thing is you check out the different ways to view your system topology, with customization in mind. Thanks for reading!