Ever wonder how to check out what is running on your system? Your workstation seems bogged down, or perhaps your server is just preforming slow. All you need is the linux top command, a monitoring software which has a pretty long history going back to 1984, part of a tooling group called procps-ng. Top has some great uses. You can use it continuously in a terminal to monitor any system you are monitoring. This could be a few servers at a time over ssh. Bringing you the statistics you need to see, from system-level applications connected to users on a server.
We will bring you the commands used in the running top application. This will help you with the basics such as stating top and closing the program to navigation and even color coding results. You can also use top to give you particular statistics. You can track a user and the programs they spawn with simple readings. Furthermore, you can do this live, or perhaps you want to start a log to help you automate the process. We will also cover this in some detail. So get ready to be topped off. Let’s jump right into it!
BASICS
Top was created about 7 years before the Linux kernel. Top is a Unix-like system compatible program that was logical to bundle with Linux distributions. From our experience, top is like vi. It’s always there to help you on a bare-bones system. So, there is no need to install it, as even an Arch base installation includes procps-ng. To view the source code or build from source, here is the GitLab if you want to check it out. Let’s check out what running top looks like.
top
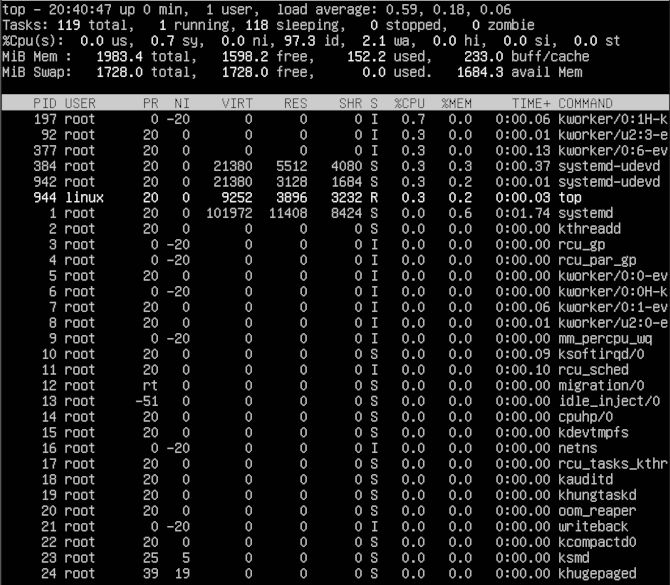
You can see you have a very verbose and ongoing readout in your terminal that contains system information in a nice format. This is useful when checking out a new system. That way you can see how heavy it runs with no extra apps running, for instance. This will help you understand how much load you can put on your system, like if you are running a web-application such as using Node or Django. That will let you know how many servers that system can run through Nginx and still function. This brings you the best use of your dollars on a VPS. Now let’s see what typing M will do.
M
Notice you will see your processes by ID, with those that take up the most memory. This can be helpful for looking up a particular process you’re testing. Now we can check out what typing T does.
T
Notice you will see your processes by ID with those that have been running the longest at the top, in descending order. Now let’s see what typing P will do.
P
Notice you will see your processes by ID in numerical order from top to bottom. Next, we will try some navigation. You can just arrow up or down here, just a straightforward way to go about things. Next, we will show you how to get some help in case you get lost, and you need to know the commands. You can get some help by typing h.
h
Now you can type q to quit the program, so we can start the next section.
q
USERS
Now we can customize the readout by adding a user to the start string. Let’s see what that looks like.
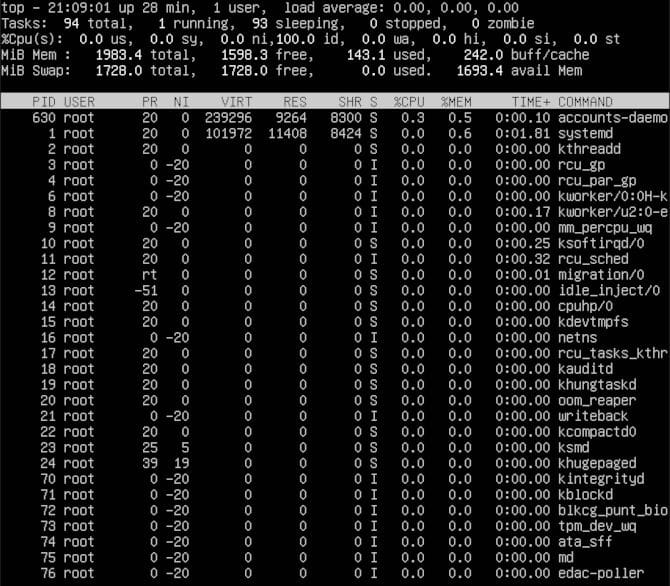
top -u yourUserName
You will want to use your username in place of “yourUserName” so that you will see the processes from that user. You can repeat this with any username. Let’s try that again with root.
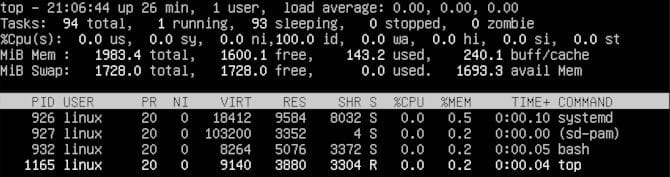
top -u root
So, you see all the root system processes that run all the time, and they can be numerous. It depends on your system. We can go ahead and quit again using q.
q
This can really be helpful if you have ever had a terminal disconnect, and by using top, you notice it’s in a ghost mode operating by itself. You can use the PID number to find it and shut it down. You can confirm that you are logged in more than once and that you want to shut down that PID.
who -u
You can also shut down any process.
sudo kill -HUP PID2Kill
You will want to make sure to replace “PID2Kill” with the appropriate PID.
LOGGING
Now that you have seen some tricks, we can show you some more. We will start with memory.
top -b -o +%MEM | head -n 15
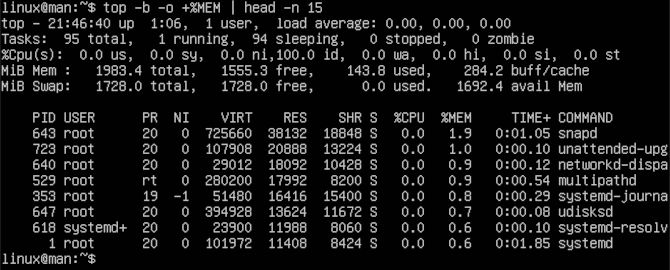
Here you will see that you get a print-out that you see in your terminal. You are not in a top session any longer. This is specific to the memory as you can see %MEM. Let me explain the other options. The –b option refers to batch mode. The next option -o refers to sorting processes. Then we will pipe ( | ) in the head utility that shows the top of the top processes in this case. That leads us to -n that we can add a number value to, in this case 15. Giving use 15 lines printed out. Let’s try this with %CPU.
top -b -o +%CPU | head -n 20
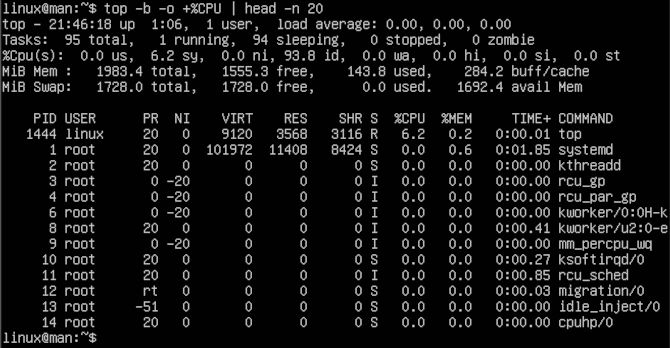
This is almost the same as before, but we will see the top CPU percentage readings rather than the memory. Which brings us to logging.
top -b -o +%MEM | head -n 15 >> ~/.top-log/memorychecks.log
What we did here is use the >> symbols to write the print-out to our “~/.custom-logs/memorychecks.log” log. This is a great way to customize logging for your application during initial deployment. That way, you can really know what is going on. You can set this to a crontab, so you can do this with automation in mind. We can now see if we can optimize those processes or see if we can do without them. It’s up to you and your stack needs.
BONUS
Finally, we come to a bonus command. We will cover how to change the color of top and customize the look of your interface. Let’s start the linux top command like before.
top
Now we want to type Z to bring up a customization menu.
Z

This will give you a few color choices, bringing things to your attention with red or even magenta.
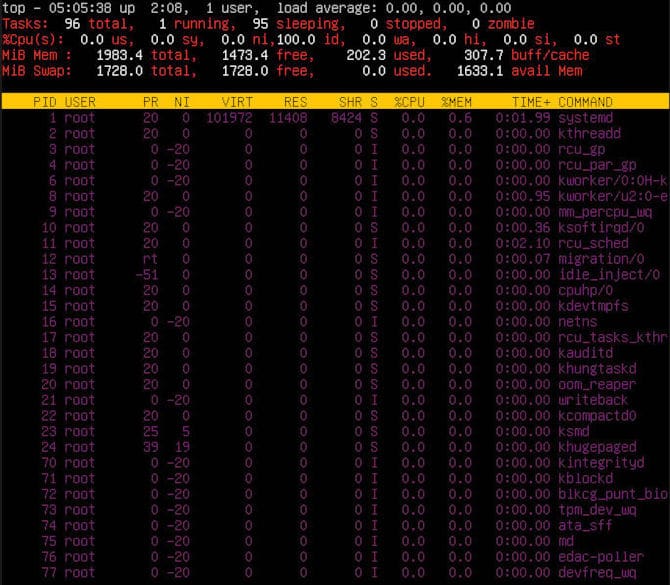
The best part about some of these older applications is just how useful they still are. Notice the colors are rather older, yet still fun to play with. You can use a few different terminals and use top to monitor a few different servers. You can monitor different processes, or even CPU and memory. Color code it and know what is what. Thanks for reading!