I have spent years working as a Project Manager and Business Analyst, and documenting processes is essential to successfully completing a task. As my third grade teacher Mrs. Cornforth used to say “You can’t get where you’re going if you don’t know where you are.” So, in order to improve a process, or even introduce something new, you still have to know what is currently being done. Sure, you can write specifications, user stories, epics… but many of the users may struggle with the verbiage. Even developers and testers who consume these documents, may want a graphical representation. For this article, we will be looking at several flowchart software tools that will be able to take some complex workflows and display them graphically.
1. LibreOffice Draw
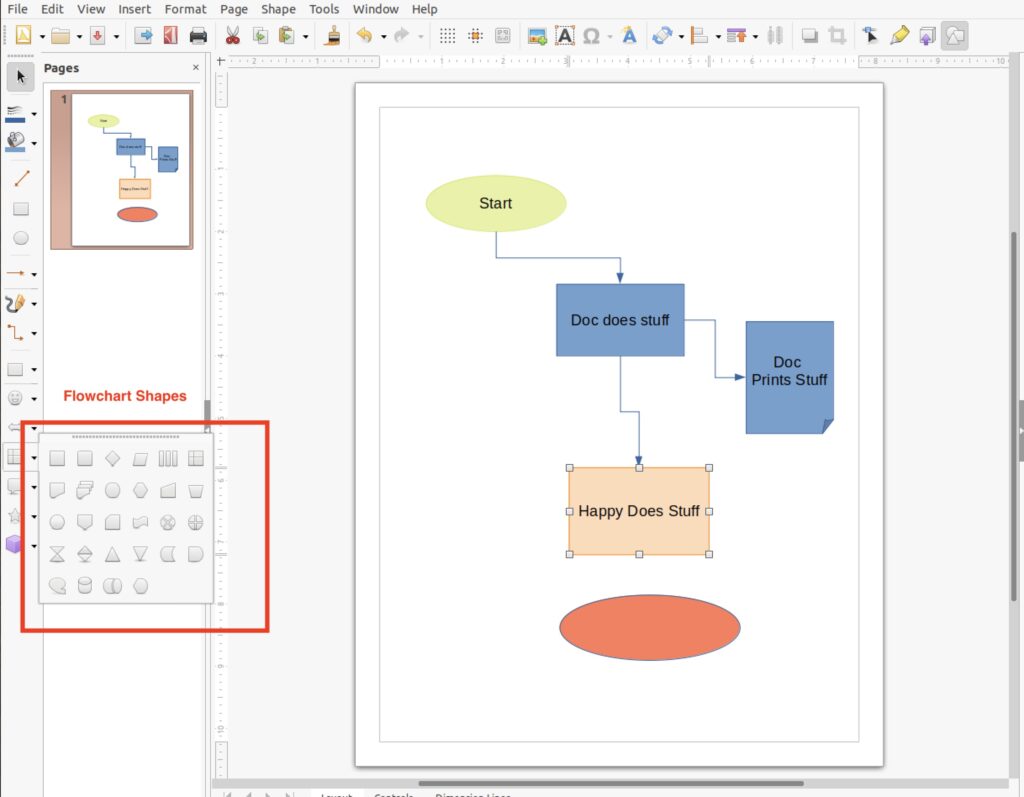
Here is tool that you may have installed on your system, and you didn’t know that it does a good job of creating basic flow charts. LibreOffice Draw (or OpenOffice Draw) is a nice simple way to create a flowchart. There is even a menu item with basic flowchart shapes.
Now, Draw is not going to win any awards for flowcharting software (and there is such a thing), but it gets the job done. The connectors connect easily and there are different shapes available. You can even install templates for other types of charts (including UI/UX) by using 3rd party templates.
What’s nice about Draw is that it is that it a serviceable diagramming tool, but it can also be used to create other types of illustrations for your documentation. I have seen other articles recommending Inkscape as a flow charting tool, which would end up causing more problems than solving. Inkscape is a truly wonderful artistic tool for vector graphics. But what makes it so powerful as an artist’s tool makes it difficult to use as a business tool.
2. yEd Graph Editor
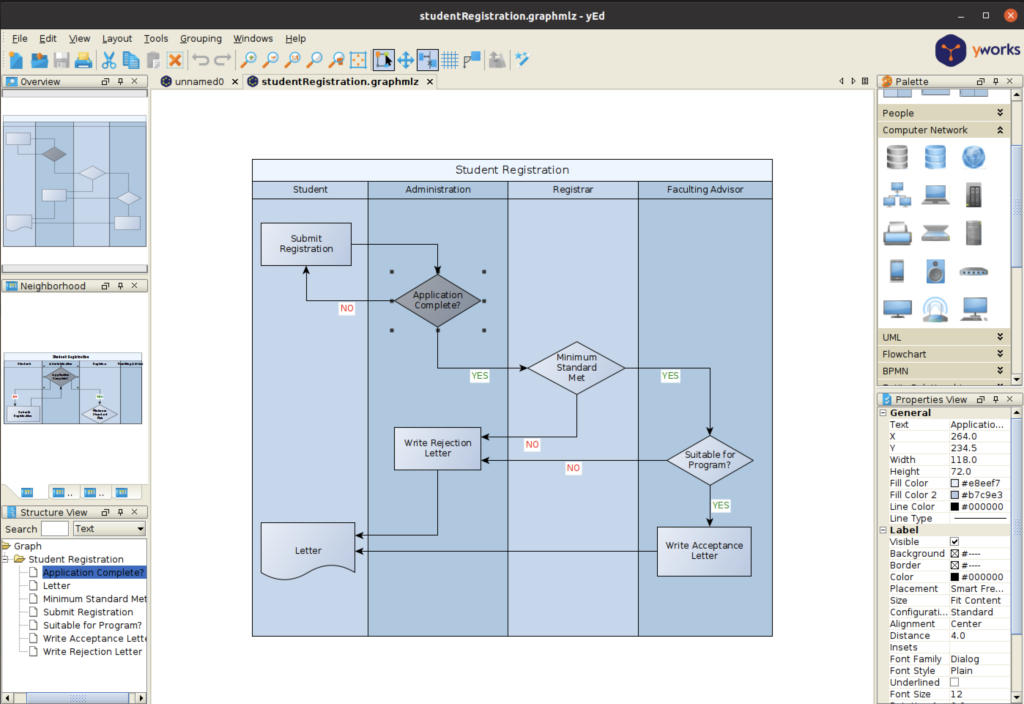
yEd Graph Editor is a very powerful tool that does a truly great job of creating flow charts. An entire book can be written on this tool’s capabilities, and it would be enjoyable.
Once you get past the very dated looking interface, it is a very good tool to use. There is built in support for:
- Flowcharts
- Swimlanes (see below)
- Unified Modeling Language (UML)
- Network Diagrams
- Business Process Model Notation (BPMN)
- Entity Relationships
- Systems Biology Graphical Notation (SBGN)
I love the neighborhood view, which shows the other “shapes” near the one you selected. The properties are many, but fairly easy to navigate. My only issue is that the icons with which it is packaged are just…not the most attractive; however you can choose to import “paletes” that fit your sense of style.
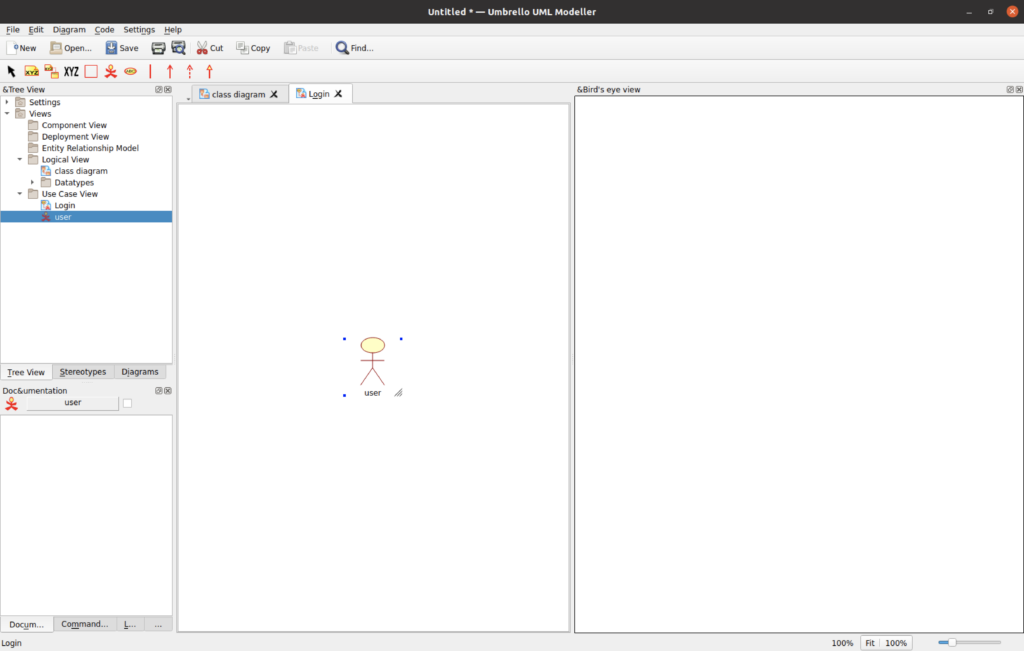
3. Umbrello
- Class Diagrams
- Sequence Diagrams
- Communication Diagrams
- Use Case Diagram
- Activity Diagram
- Component Diagram
- Deployment Diagram
- Entity Relationship Diagram
4. Minder for Mind Mapping
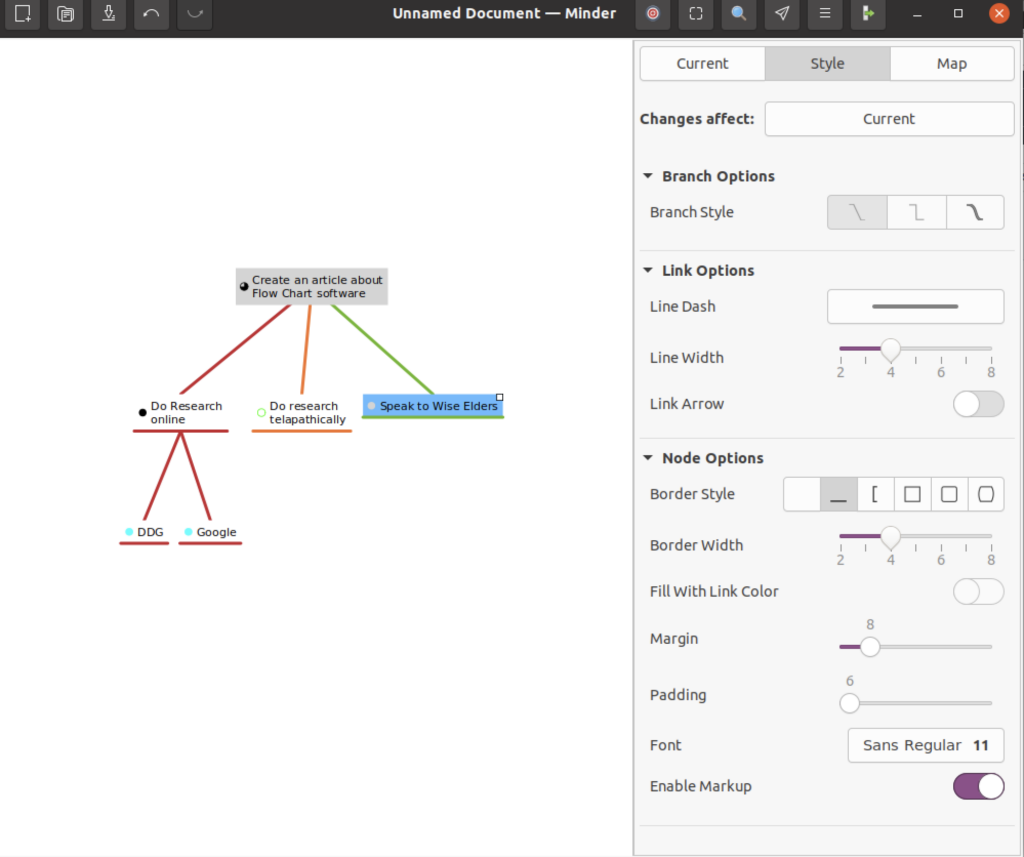
Mind-mapping is a special process for documenting organic discussion or ideas. People (particularly in a group) don’t always think linearly, but some of the best ideas come from free form discussions. There are multiple tools to choose from but I like Minder the best. It is easy to use, and once you get used to the interface, you can quickly type and navigate to keep up with the conversation. It has solid export features (.bmp, .csv., Freemind, pdf, svg, yED…) and lets you create a task list for the nodes that you can check off when completed.
Minder is not perfect, but it is free and creates a document you can share with your team.
5. Draw.io
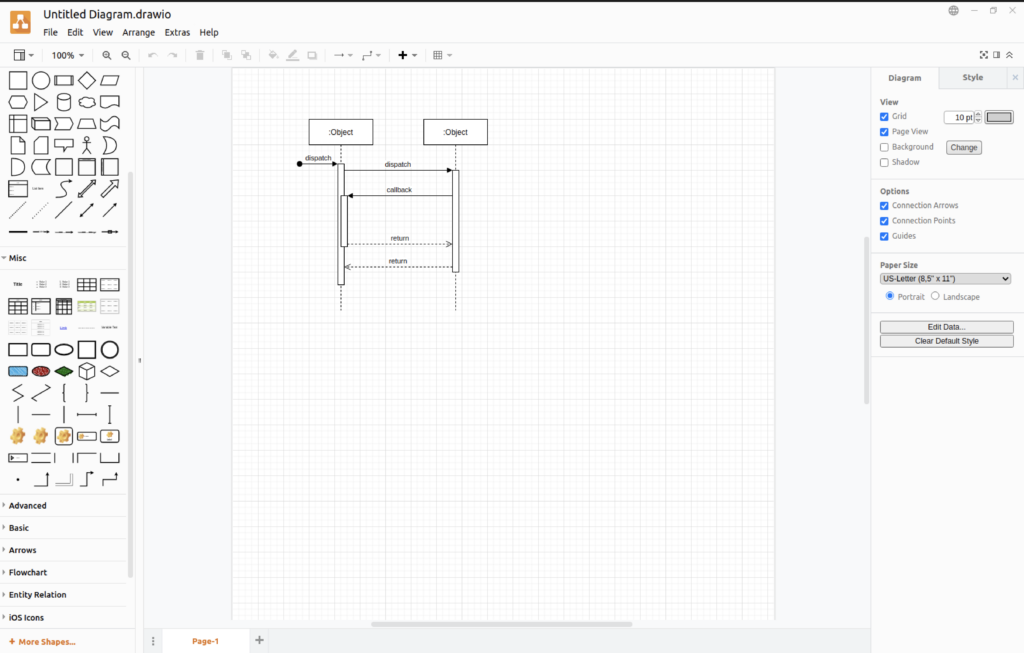
A lot of people think Visio from Microsoft is one of the best diagramming tools around. Now, I have used Visio for years, and it is very powerful, but I also think Draw.io is a good alternative. While it lacks in database connectivity and office integration, it is much simpler to use. In addition, there is also the ability to add custom shapes and embed office documents.
Another helpful feature is that there is a web-only version of this tool. Thus, if you keep your documents in a cloud folder (or somewhere else accessible to your device) you can load the file into the web version and edit on your phone tablet or a different computer.
There is a lot to like with Draw.io. I use it quite a bit. The basic types of diagrams it supports is a bit overwhelming:
- Basic flow chart
- Venn Diagrams
- Mind Maps (5 types)
- Organization charts
- UML
- UI/UX Layouts
- Gantt charts
- Floor Plans
- Database entity relationships
- …and many more
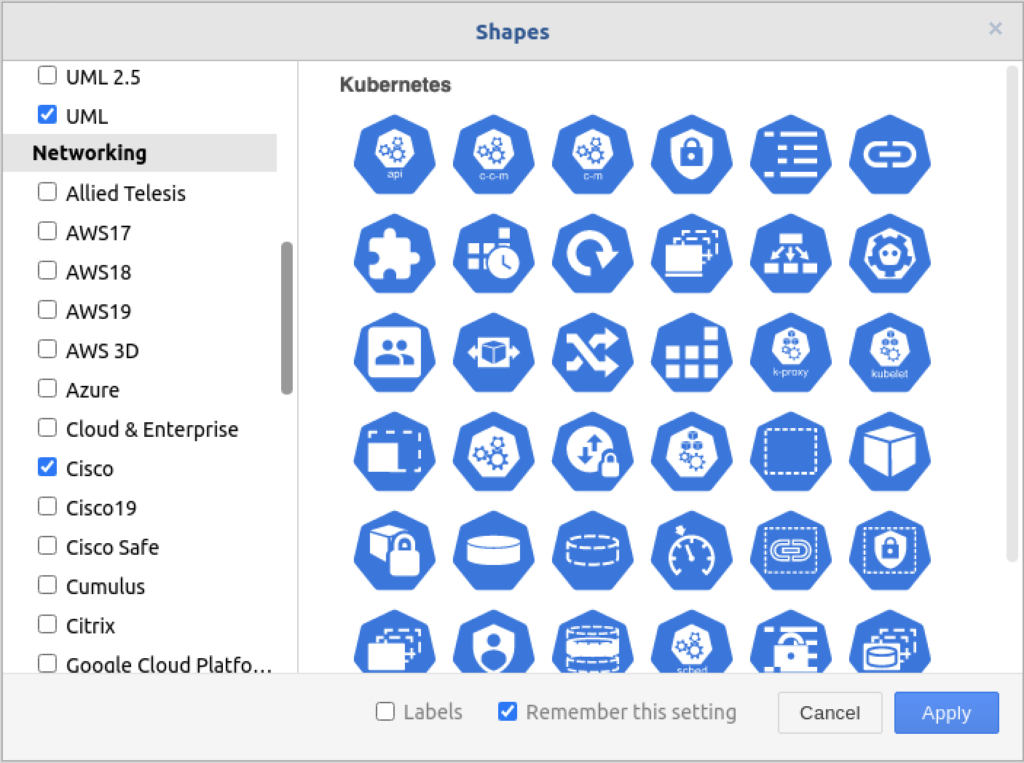
There are limitations to Draw.io. It can get a little slow with large diagrams (and you will have a lot of fun with this tool, and will create large diagrams). Also, a lot of the templates and shapes have the same look and feel. They are clean and flat, but sometimes you want different. Fortunately, Draw.io lets you customize the shapes. You will certainly unleash your inner BA with this tool.

